The Failures of AI Pneumonia Classification
A Hard Journey Ahead
One of the most common datasets used in radiology research is that of the MIMIC-IV dataset. It’s an extensive, dataset scrubbed of identifying factors that holds many labeled cases of ICU chest radiographs. AI runs into two problems here.
- AI likes to generalize, and when faced with abnormalities, doesn’t know how to behave.
- AI needs consistently accurate data, and in abnormal cases more commonly found in the ICU, the disagreement rate of diagnosis among radiologists is as high as 30%.
These two factors make creating an AI to correctly diagnose radiographs much more challenging.
The Original CheXpert Paper:
I remember when first getting into AI that radiologists were being pitted against AI and AI was coming out on top. While this wasn’t entirely true, the news flew everywhere.
CheXpert is a large dataset of chest X-rays for automated chest x-ray interpretation, and in trying to understand this subject deeply there are some frustrating questions I’ve come across with no clear answer.
The introductory paper to CheXpert links to a paper led by AI superstar, Andrew Ng at Stanford University. Using 223,316 images of 65,240 patients in inpatient and outpatient care centers at Stanford Health, and 14 recovered labels of possible outcomes returned from NLP processing terms.
The labels for every image were either negative, being a clear no, positive, being a clear yes, or uncertain, where the diagnosis remained unknown. Most labels are uncertain, as little mention of all 14 diseases is uncommon in a radiology report.
Here we start to see something interesting, in what they do with said missing labels. Normally, we’d only want to train and learn from the values we know for sure (U-Ignore). But we can also take the majority of these unknown values and fill them in, and two ways are quite interesting. U-Zeros fills in the values with zeros, indicating no preference, which in most cases is very similar to that of negative values. U-Ones will replace all uncertain labels with positive results. This is the more interesting case, in that since we’re assigning every patient with the majority of the diseases, you’d figure we’d see a degradation in results, but this is not the case.
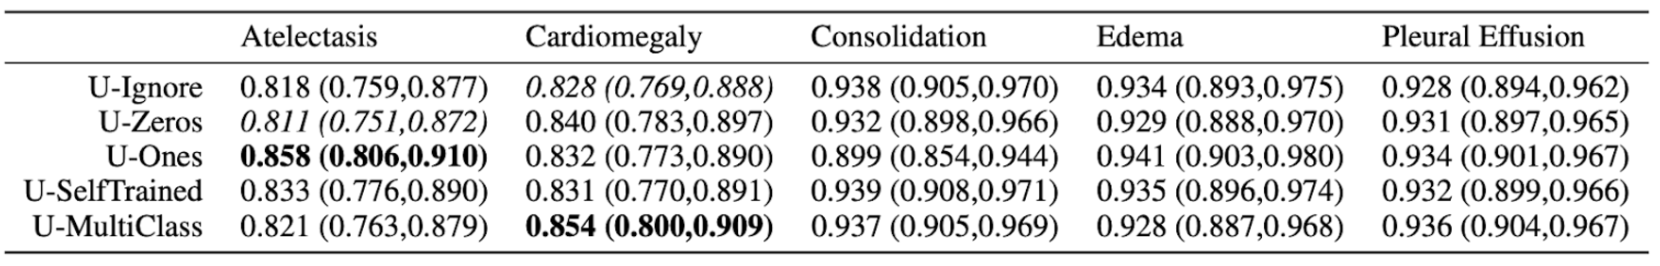
Not only are these results questionable, the variability in results makes the final results suspect towards the reliability of this model.
Only 500 chest studies were used as testing sets on only 5 selected pathologies rather than the whole 14.
The data is shown in a table, rather than that of a graph which would’ve made more sense. The reason for why this may be apparent if we show the graph. Here are the mean values AUCs:
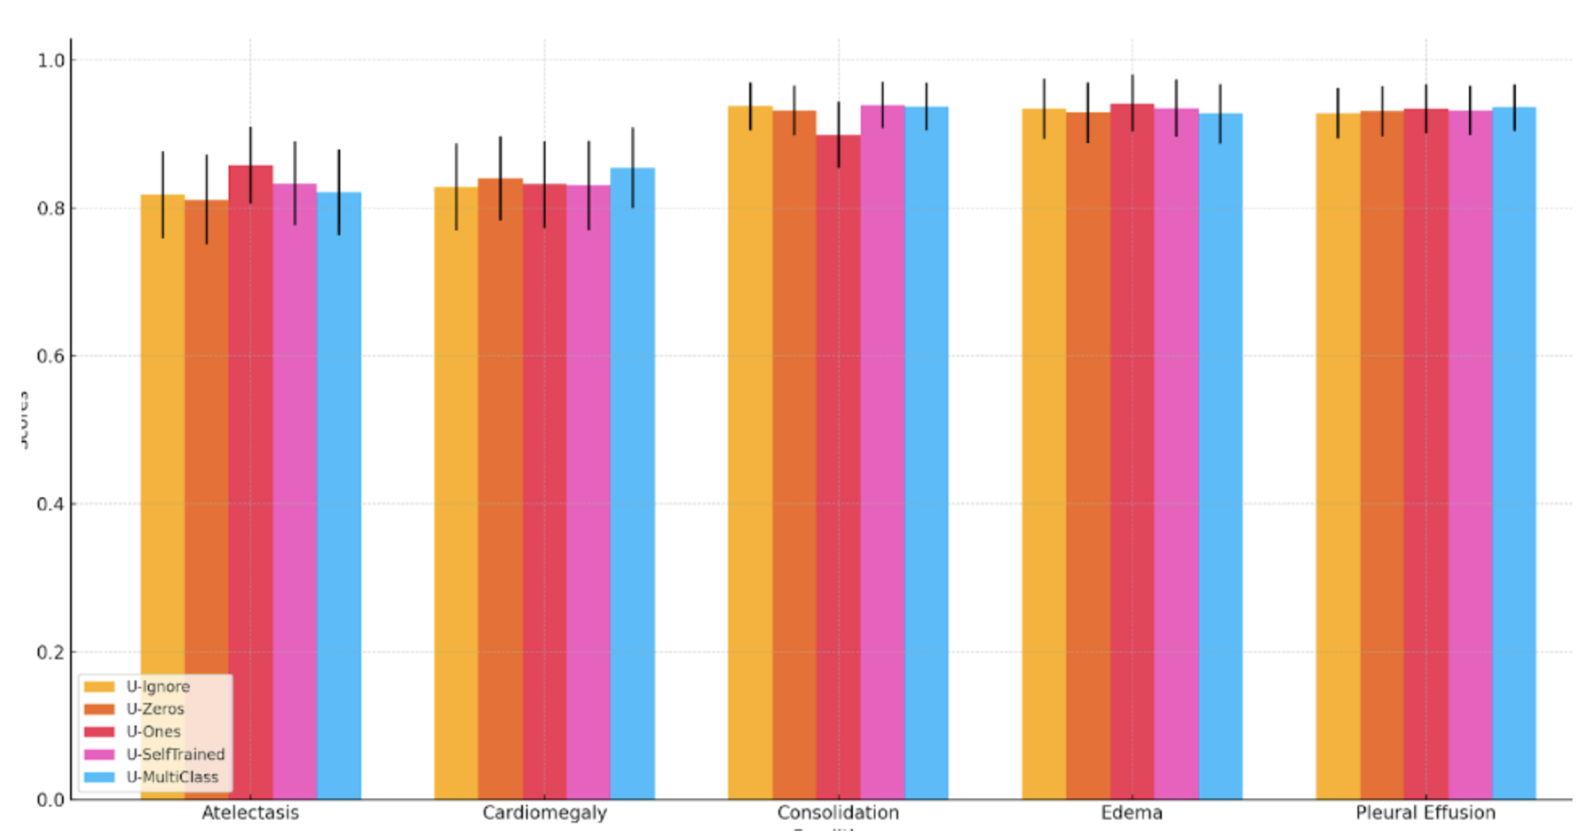
It would seem as though there is no significant difference between the methodologies, but the authors argue that there is some statistical significance. For Atelectasis the U-Ones outperforms U-Zeros with p=0.03. For Cardiomegaly, U-Multiclass performs significantly better than U-Ignore (p < 0.01). They use a non-parametric method by DeLong to determine the statistical significance. An issue that arises here is that given the number of comparisons being made, the requirement for statistical significance also increases. The original method compares two random distributions of AUCs, however when we have 5 groups where we have 10 separate comparisons being made, 50 comparisons require a much higher bar to be considered statistically significant.
Promising First Results:
While there are some gripes, the paper discussed, released in December 2017, was a landmark paper from Stanford was released showing how a deep convolutional neural network DenseNet-121 was able to accurately diagnose 14 of the most common ICU diseases better than practicing radiologists (based solely on imaging). In my personal interest area of pneumonia, the accuracy of detecting pneumonia was 76%. The average AUC was 0.72.
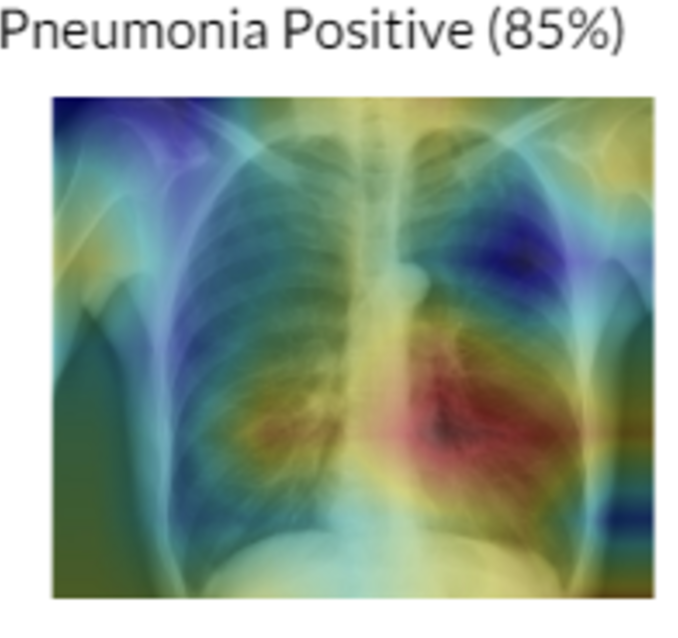
Heatmaps were also introduced to help radiologists point out areas of key interest! This was an amazing paper.
A Waste Of Potential:
For my own research reasons, I wanted to see how good a pneumonia diagnosis can get. One problem often encountered in research is the very basic question “how is this research useful?” For a lot of these new papers, we find that the usefulness contradicts the accuracy we get. Papers for pneumonia detection quickly rise from the original 76% to 87%, 89%, 97.8%, 98%, 98.81%, 99.52%, and eventually 100%. But wait, why is this bad? These papers all show the diagnosis of pneumonia drastically improving to eventually getting perfect results! So what gives? The data gives. Here are some pictures of the architectures used in these papers, then I’ll address why all this intelligent design is wasted.
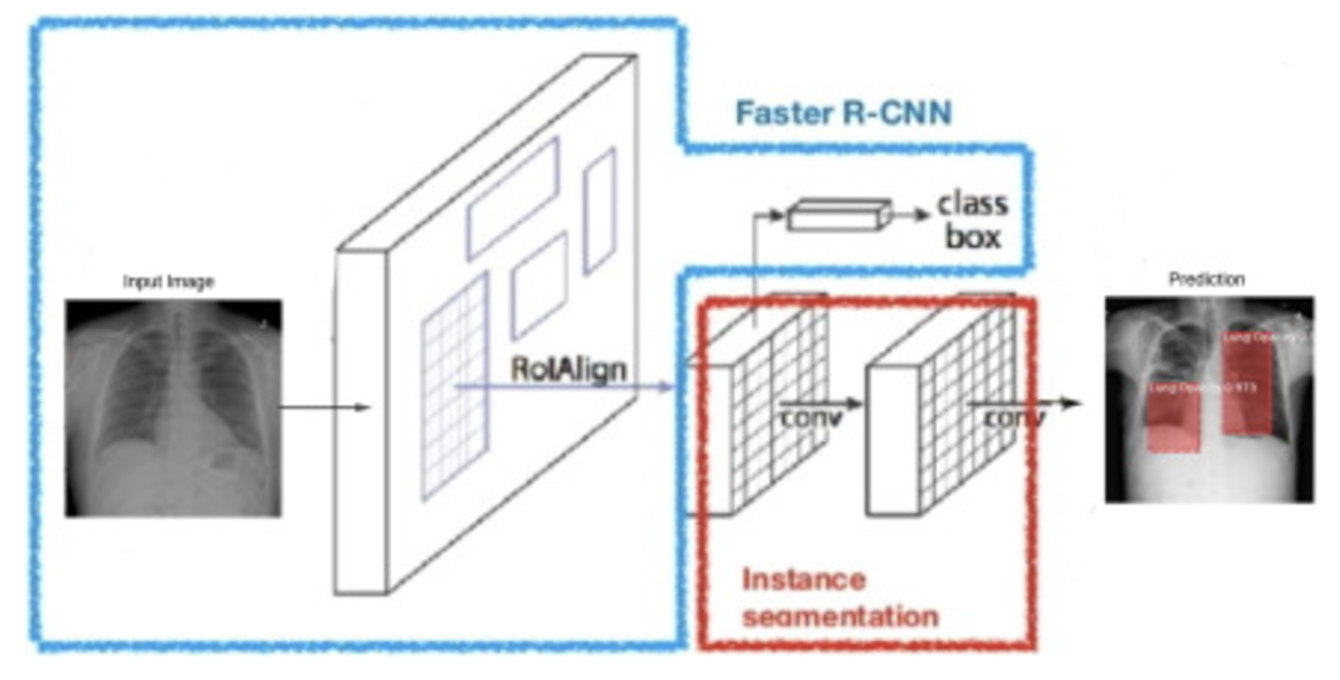
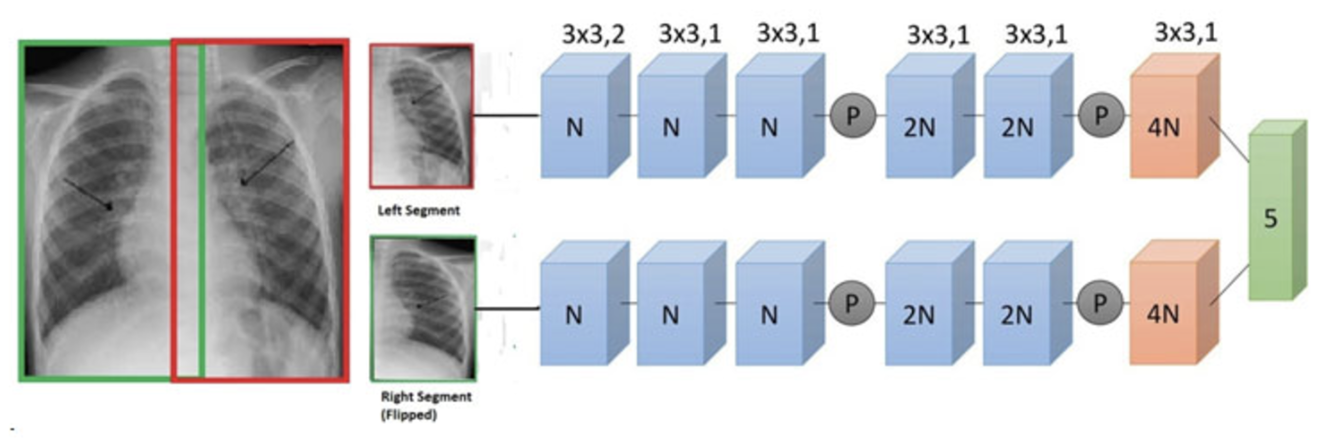
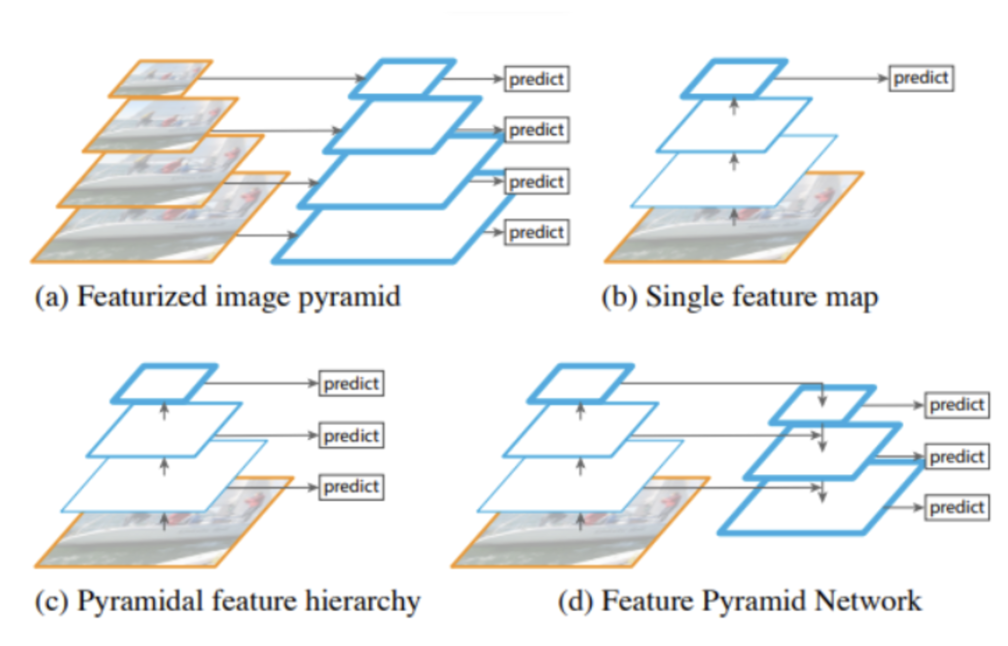
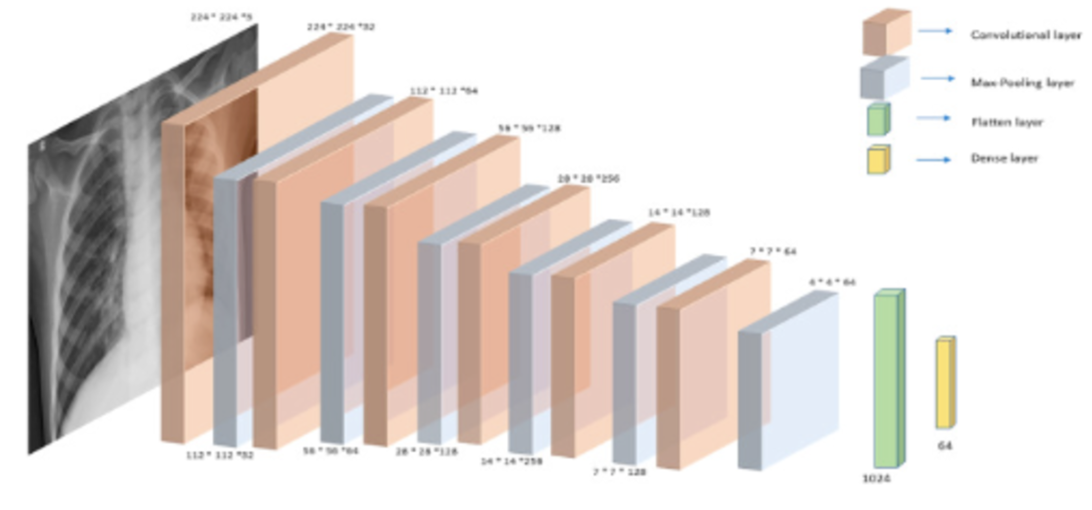
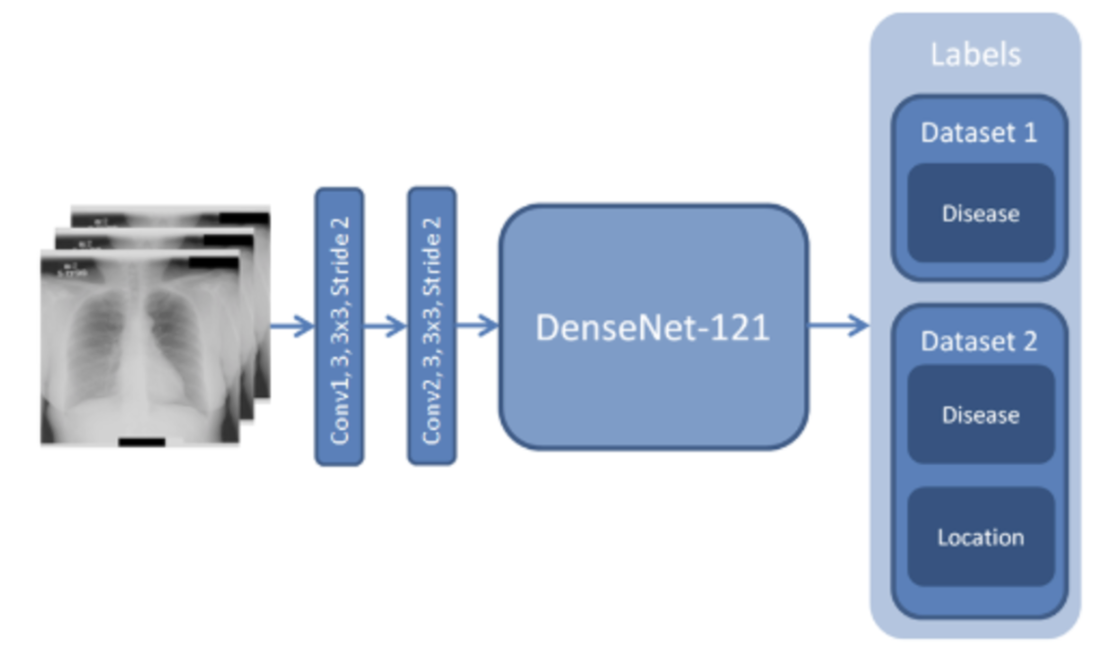
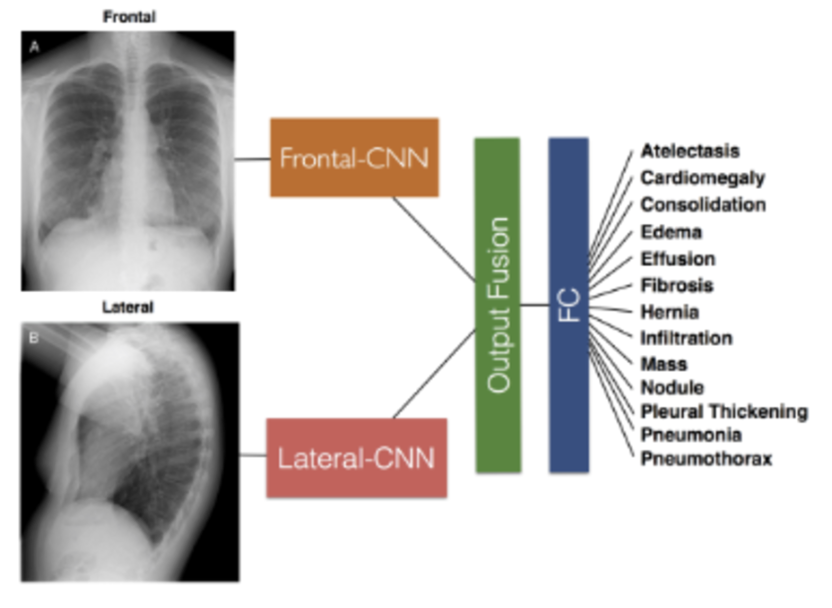
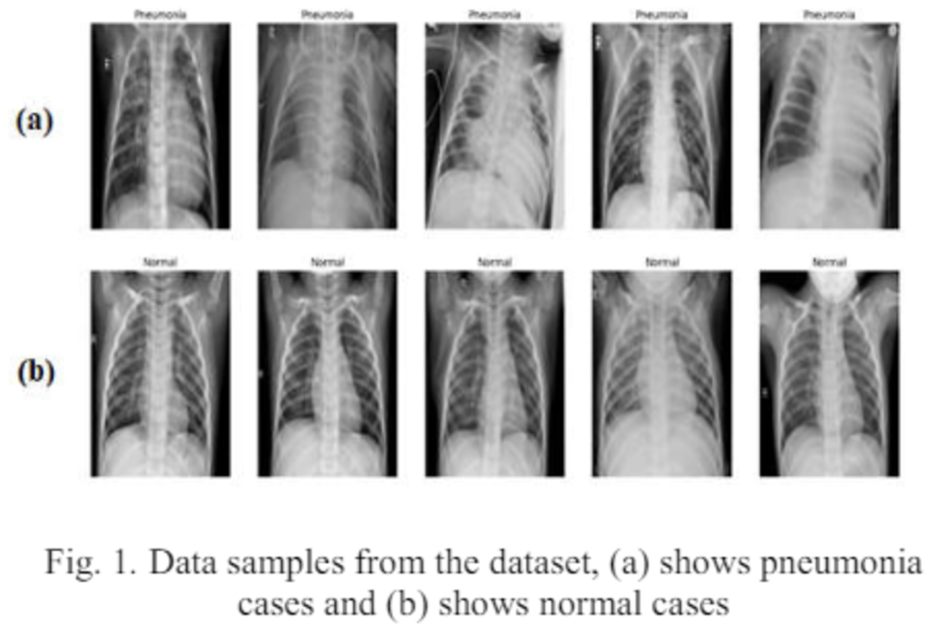
These methods that get good results work well, but we can’t use any of them in a diagnostic environment because the data after the original paper is only trained on healthy people (no pneumonia) versus unhealthy people (only pneumonia, no other diseases).
This means that a model only has to see if there is any fogginess in the image and it’ll write pneumonia or not. What happens if another condition is shown to this algorithm that isn’t pneumonia? Because we’re only looking at pneumonia or healthy people in all of these models, if any other condition arises, the model will fail to be able to know what to do. It may just say “This is pneumonia because it’s not what a healthy person looks like!”. A real model will distinguish pneumonia between any other possible condition, not just what a healthy person looks like.
More Errors in Reporting:
Not only are the methodologies of these pneumonia papers flawed, they have very poor reporting standards. A paper after the original stanford paper talked about how in changing the preprocessing slightly, there was a 2% increase in accuracy. The issue is we don’t know the range in which accuracy varies for the existing method or the new method. Our first and second method could simply vary by 2% and be equivalent, or an author can run their experiments multiple times until they get favorable results. Due to the randomness in AI diagnostics, we have to run the model multiple times with multiple seeds, or use classification models that accurately record a range of variability in performance.
(2019) Early Diagnosis of Pneumonia with Deep Learning
78.3% accuracy. 3,000 images for training, 1,000 for testing. 9 layer Resnet. Got better results by including color contrasting techniques during preprocessing. Only managed at most a 2% increase in accuracy with no confidence intervals.
This paper goes into detail about the needed improvements in medical reporting for AI. Is the paper retrospective or prospective, prognostic or diagnostic? How can this algorithm actually be used in the real world (our high accuracy pneumonia papers had no real world impact). How do existing models perform in comparison as a baseline? How is the data structured? How is data imputed? What are errors in the model presented and is there a scenario in which this model shouldn’t be trusted? How might this augment existing clinical workflows? What biases or ethical concerns may exist from this model? There are many more considerations talked about in the paper, but the point is that many of these papers don’t even do the bare minimum in quality reporting.
One 2021 paper that really brings this message home is a paper titled “The false hope of current approaches to explainable artificial intelligence in health care”, and how after the original Stanford paper four years ago we haven’t seen any improvements in useful, explainable diagnostic AI.
Other powerful papers discuss the importance of proper scientific processes, and how researchers hungry for new publications can overfit data unintentionally by running experiments with new hyperparameters over and over again. This paper gives a good example to the issue with stepwise selection and the issues of overfitting it may incur. We essentially torture our data and hyperparameters and architecture so much, when we finally do get a good result it’s hard to know if we’re geniuses, or just got lucky.
Finally, New Results!
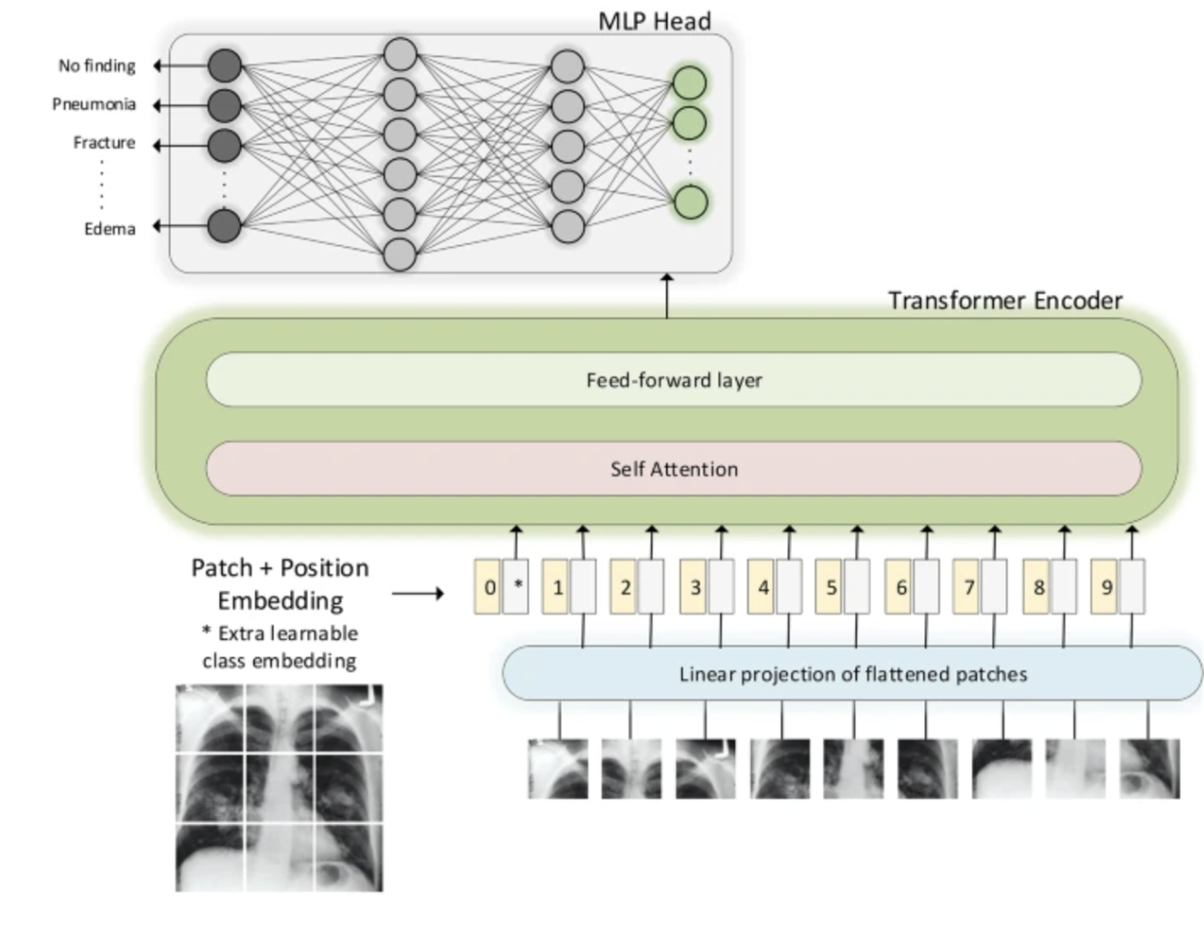
In 2022 transformers were used to go from 0.435 AUC to 0.59! Then a year later we go from 0.59 to 0.77 through improving transformer architectures and incorporating multimodal data! The total accuracy isn’t stated, however it may be approaching the reasonable limit for AI, as anything past 85% is entering areas where diagnoses aren’t wrong because of the AI, but because the diagnostic labeling of radiologists isn’t the best in abnormal ICU cases.
There are a lot of interesting ideas in terms of what can be done to improve this, how to verify results, and what other forms of data can be included to assist in radiology diagnosis. Understanding and solving these issues is genuinely important for the lives and well-being of many across the globe. Using AI we can make the world a better place.
Takeaways:
In AI research we currently find issues with:
- Generalization issues.
- Data quality concerns by which radiologists don’t agree on a label, or labels are chosen using automated and imprecise nlp standards.
- Statistical significance is oftentimes stretched inappropriately in papers.
- Datasets may be oversimplified and not represent real-world ability.
- There is a lack of robust methodologies for guaranteeing our models don’t overfit.
- Transformers may hold a key in finally seeing major improvements in real-world AI diagnostic abilities.
Bingo Bongo 🙂